Quick start
We will guide you through the main features of niimpy. This guide assumes that you have basic knowledge of Python. Also, please refers to the installation page for installing niimpy.
This guide provides an example of reading and handling Aware battery data. The tutorial will guide you through 4 basic steps of a data analysis pipeline:
Reading
Preprocessing
Visualization
Basic analysis
[1]:
# Setting up plotly environment
import plotly.io as pio
pio.renderers.default = "png"
[2]:
import numpy as np
import niimpy
from niimpy import config
from niimpy.exploration.eda import punchcard, missingness
from niimpy.preprocessing import battery
Reading
niimpy provides a simple function to read data from csv and sqlite database. We will read a csv file containing 1 month of battery data from an individual.
[3]:
df = niimpy.read_csv(config.MULTIUSER_AWARE_BATTERY_PATH, tz='Europe/Helsinki')
df.head()
[3]:
| user | device | time | battery_level | battery_status | battery_health | battery_adaptor | datetime | |
|---|---|---|---|---|---|---|---|---|
| 2020-01-09 02:20:02.924999936+02:00 | jd9INuQ5BBlW | 3p83yASkOb_B | 1.578529e+09 | 74 | 3 | 2 | 0 | 2020-01-09 02:20:02.924999936+02:00 |
| 2020-01-09 02:21:30.405999872+02:00 | jd9INuQ5BBlW | 3p83yASkOb_B | 1.578529e+09 | 73 | 3 | 2 | 0 | 2020-01-09 02:21:30.405999872+02:00 |
| 2020-01-09 02:24:12.805999872+02:00 | jd9INuQ5BBlW | 3p83yASkOb_B | 1.578529e+09 | 72 | 3 | 2 | 0 | 2020-01-09 02:24:12.805999872+02:00 |
| 2020-01-09 02:35:38.561000192+02:00 | jd9INuQ5BBlW | 3p83yASkOb_B | 1.578530e+09 | 72 | 2 | 2 | 0 | 2020-01-09 02:35:38.561000192+02:00 |
| 2020-01-09 02:35:38.953000192+02:00 | jd9INuQ5BBlW | 3p83yASkOb_B | 1.578530e+09 | 72 | 2 | 2 | 2 | 2020-01-09 02:35:38.953000192+02:00 |
Preprocessing
There are various ways to handle battery data. For example, you can extract the gaps between consecutive battery timestamps.
[4]:
gaps = battery.battery_gaps(df, {})
gaps.head()
[4]:
| battery_gap | ||
|---|---|---|
| user | ||
| iGyXetHE3S8u | 2019-08-05 14:00:00+03:00 | 0 days 00:01:18.600000 |
| 2019-08-05 14:30:00+03:00 | 0 days 00:27:18.396000 | |
| 2019-08-05 15:00:00+03:00 | 0 days 00:51:11.997000192 | |
| 2019-08-05 15:30:00+03:00 | NaT | |
| 2019-08-05 16:00:00+03:00 | 0 days 00:59:23.522999808 |
niimpy can also extract the amount of battery data found within an interval.
[5]:
occurences = battery.battery_occurrences(df, {"resample_args": {"rule": "1H"}})
occurences.head()
[5]:
| occurrences | ||
|---|---|---|
| user | ||
| iGyXetHE3S8u | 2019-08-05 14:00:00+03:00 | 3 |
| 2019-08-05 15:00:00+03:00 | 1 | |
| 2019-08-05 16:00:00+03:00 | 1 | |
| 2019-08-05 17:00:00+03:00 | 1 | |
| 2019-08-05 18:00:00+03:00 | 1 |
Visualization
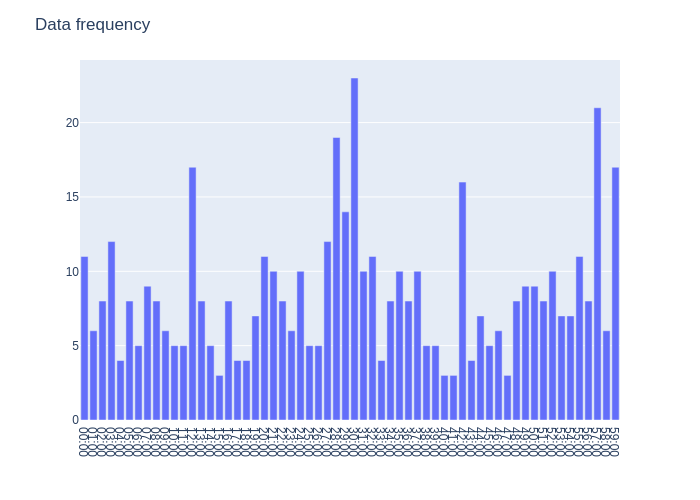
niimpy provides a selection of visualization tools curated for exploring behavioural data. For example, you can examine the frenquency of battery level in specified interval.
[6]:
fig = missingness.bar_count(df, columns=['battery_level'], sampling_freq='T')
fig.show()
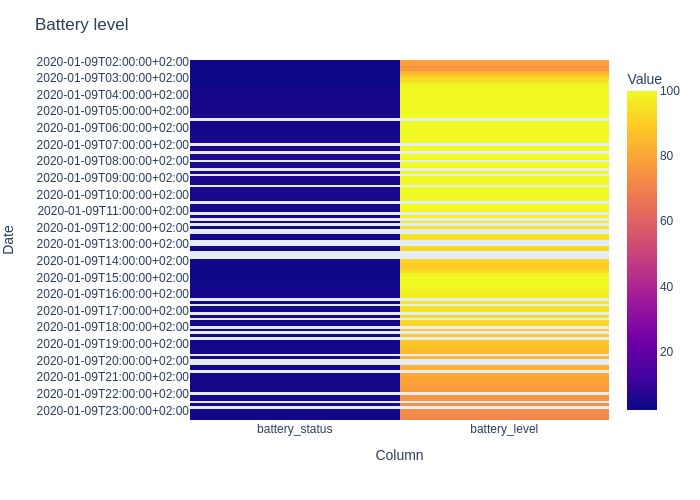
In addition, you can analyze the battery level at each sampling interval by using a punchcard plot.
[7]:
fig = punchcard.punchcard_plot(df,
                                   user_list=['jd9INuQ5BBlW'],
                                   columns=['battery_status', 'battery_level'],
                                   resample='10T',
                                   title="Battery level")
fig.show()
For more information, refer to the Exploration section.